FES Assistive Device

Final Demonstration!

The final demonstration was overall a success. Thank you to our mentors, Dr. Sikdar & Dr. Harris – Love for their guidance. Thank you Dr. Ross for instructing us throughout the entirety of the Senior Design coursework.

WhatsApp Image 2017-12-16 at 11.39.57 AM

Final Presentation

FinalPresentation

After our final presentation of Senior Design II.

Variance of Joint Angle

To further analyze for variance of the joint angle movement, a mean curve for yaw (dark blue curve) is shown in the figure below. The shaded region depicts one standard deviation of variance in the joint angle movement. This is a set of twenty trials for one of the subjects. The plot of standard variance illustrates that the joint angles for individual subjects are within one standard deviation of the mean yaw curve.

VarianceCurve

Optimal parameters found

After completion of all testing, the optimal parameters for stimulation for three subjects were determined, and outlined in the following table. Subjects 1 and 2 had optimal amplitudes at 25 mA, while subject 3 had their optimal amplitude at 20 mA. It shows that each subject’s body type is different and how they respond to stimulation varies as well. While subjects 1 and 2 had a greater stimulation tolerance, subject 3 had a lower tolerance.

CustomizedParameters

Changing Frequencies

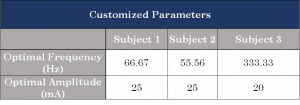
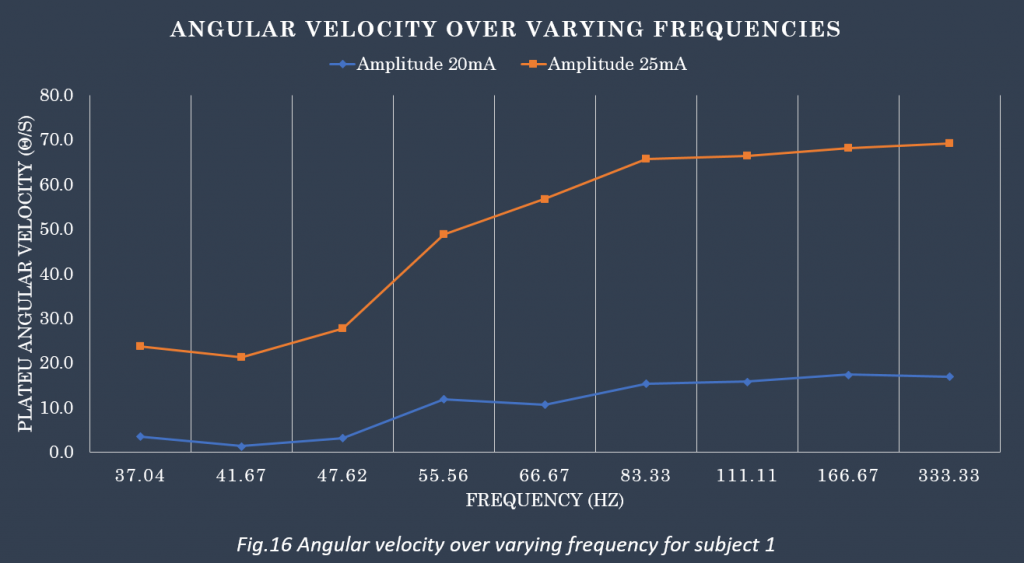
Our next set of trials, 3 subjects performed these trials. This test we changed the frequency of stimulation by modifying the period parameter of the stimulator. Since, frequency = 1/period.   We started from a period of 27 ms (a frequency of 37.04 Hz) and decremented by 3 ms until we reached a period of 3 ms (a frequency of 333.33 Hz). We kept the amplitude constant, a set of trials with 20 mA and a set with 25 mA.

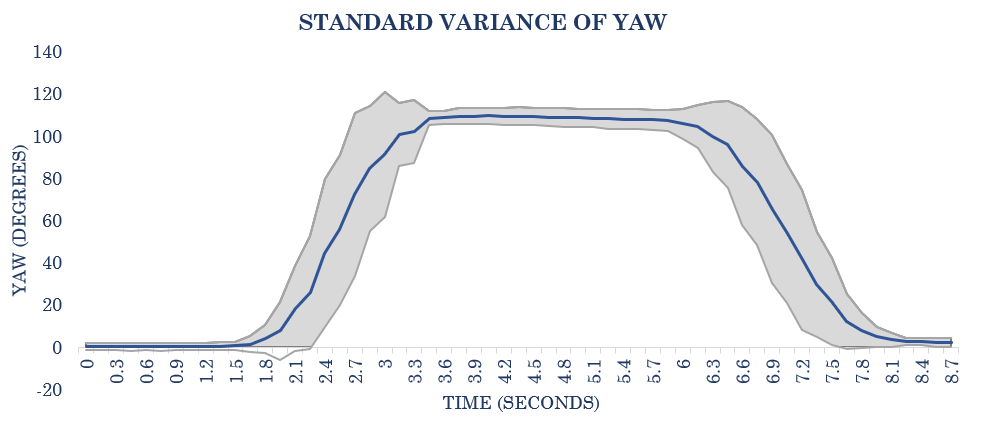
Using this data, we analyzed the angular velocity of the yaw angle during the plateau of the ramp. The graph below has data from subject 1. As the amplitudes increase and the frequencies increase, the arm starts to move faster. Comparing the different amplitudes of the curves, it’s seen for the 20 mA, the velocity is lower than the velocity of the 25 mA. And the curves, gradually increase as the frequency increases as well.

AngularVelocity1

Post-Stroke Patients

PostStrokePatients

We also observed stroke patients to look into analyzing for additional parameters as well as looking into limitations of our design. The picture of the left is the stroke patient attempting to voluntarily move their arm without stimulation and some support, their arm isn’t moving too much. The picture of the right shows them attempting to reach with stimulation and assistance. You can see that their shoulder has moved up due to stimulation of the anterior deltoids. But stimulating the triceps doesn’t move the forearms due to the overwhelming spasticity of the biceps. We saw that stimulation has some limitations when trying to overcome spasticity. Therefore, we saw that we were limited to mild to low spastic patients.

Synchronizing Data

Due to MATLAB’s lack of multithreading capability, the two laptops must be synced in time such that all signals are initiated, elongated, and terminated at the same. An instance of this is shown in the plot below. The yaw angle is shown in orange and the customized stimulation ramp in blue. The characteristics of arm extension for each subject was observed.

Synchronized Curves

Updated methods

With a change in design comes a change in methods. The following flowchart illustrates the new methodology.

new methods

Figure showing new design methods.

Using Two Laptops

Since, our last update, we have decided on a new design. Our design is now using two laptops rather than one. Our attempt at parallel processing has been unsuccessful, since Simulink doesn’t allow for any parallel processing even using Python.

The two laptops are used as follows: 1) to work with Simulink, handling stimulation connected to the RehaStim 2, and 2) for the collection of IMU data through Arduino, processing both the acceleration and yaw.

This is a model of our current design:

Design


October 9 Update

We are working on incorporating two sensors to our design. The reason we need to do this is because we need one sensor to detect the initial movement of the subject’s shoulder and the second sensor is used to detect the movement of the forearm attempting to perform the reaching movement. Using our IMU sensors (MPU 6050) and the Arduino board, we connected them onto the bread board using the schema shown below.

Scheme 2 GY-521

After the hardware was connected properly, we are now developing the Arduino code that gathers data from both sensors.

Next Page »