
Variance of Joint Angle
Posted by djayakum in November 30, 2017  Comments(0)
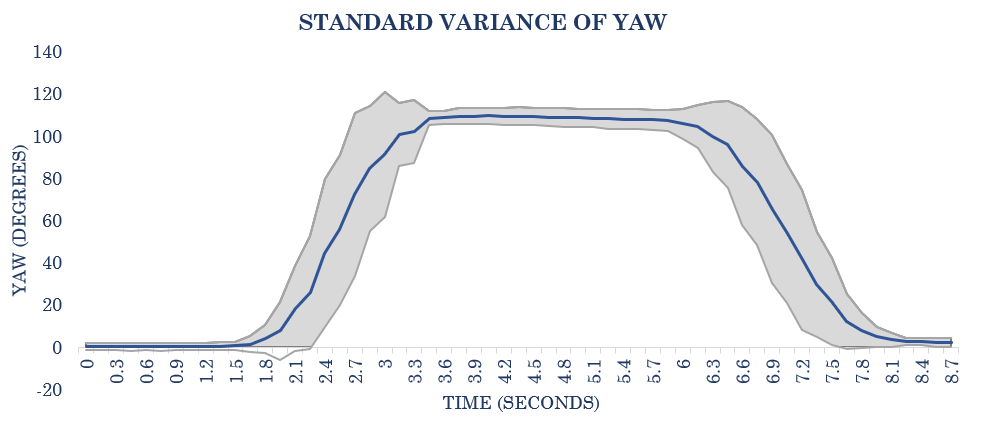
Comments(0) To further analyze for variance of the joint angle movement, a mean curve for yaw (dark blue curve) is shown in the figure below. The shaded region depicts one standard deviation of variance in the joint angle movement. This is a set of twenty trials for one of the subjects. The plot of standard variance illustrates that the joint angles for individual subjects are within one standard deviation of the mean yaw curve.
Leave a Reply